Abstract. Mobilities of sodium ions and their clusters
in different gases have been measured by gamma-ray spectrometry using the 20
ms isomeric state of 24Na as tracer. This isomer is obtained through
the ß--decay of 24Ne, which was
produced by bombarding 22Ne with the 7 MeV triton
beam of a cyclotron. In a later experiment 24Ne was
produced by irradiation of a target containing 26Mg with the
bremsstrahlung of a 60 MeV electron beam of a linear accelerator.
This new technique of measurement can be used to
determine the mobility of sodium ions in non-reacting gases of a pressure
higher than 1 mbar. Measurements have been carried out in gases of
pressures ranging from 6 mbar to 1000 mbar under an electric field up to 250
V/cm at room temperature. The measured mobility of 24Na+ in pure neon
gas at 1000 mbar was determined to be 3.2 cm2/Vs. This
value is much lower than the zero field mobility of about 8.5 cm2/Vs measured
by Tyndall [1] and Akridge [2].
A small amount of polar molecules such as water or
ethanol introduced into the drift tube causes their clustering with the sodium
ions through monopole-dipole interaction, resulting in a strong decrease in the
mobility. This clustering effect has been studied for various combinations of
polar molecules and inert gases.
The usable pressure range from 1 mbar to high
pressures in the range of some hundred bars is interesting because most other
methods for cluster studies do not work at such high pressures. With this
method it should be possible to measure the mobility change of sodium ions
towards the condensation point and eventually even towards the critical point.
PACS: 34.90.+q
![]()
1. Introduction
24Ne is ß- instable
with a half-life-time of 3 minutes by emitting two gamma rays with energies of
874 keV and 472 keV. The former decay is prompt, but the latter is delayed
with a half-life-time of 20 msec (fig. 1).
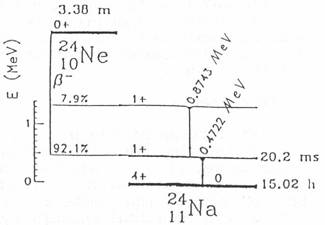
Fig. 1: Decay scheme of 24Ne [3].
This fact gives us an excellent opportunity to use 24Ne as a generator
of this 472 keV isomeric state of 24Na which can
be used as a tracer to measure phenomena which occur in the time scale of about
20 milliseconds.

Fig. 2:
Change in the probability of detecting ions moving in an electrical field. t=0:
874 keV photon. t=20ms: 472 keV with larger detection probability
We have measured drift velocities of Na+ ions and
of clusters built on these ions by measuring the change in the solid angle
subtended by a Ge(Li) gamma ray detector when the sodium ions (clusters) are
accelerated by electric fields (Fig. 2). We have measured the ratio of
intensity of the 472 keV line to that at 874 keV as a function of gas
pressures and applied voltages on electrodes between which gases containing 24Ne are introduced.
2. Experimental
Two different methods for production of 24Ne have been
used.
2.1. Production of 24Ne by bombarding 22Ne with
tritons
A gas target (fig. 3) with enriched 22Ne is irradiated with the 7.2 MeV triton beam of
the compact cyclotron of the Technical University of Munich [2]. When enough 24Ne is
produced, the gas is pumped into the ion acceleration chamber in another room
in order to avoid the neutrons and the background activity caused by the
cyclotron. The measurement of the gamma spectrum is started after applying the
electrical field in the ion acceleration chamber. After the measurement the gas
is pumped back to the irradiation chamber and a new cycle of experiment begins.
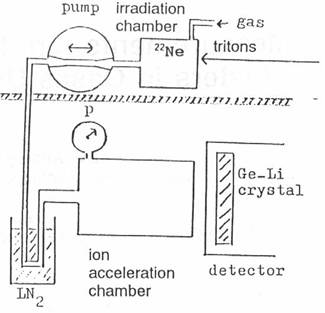
Fig.
3: Schematic picture
of the experimental setup
2.2. Production of 24Ne by irradiation of 26Mg with gamma
rays
At the electron linear accelerator of the Tohoku
University Sendai the 60 MeV electrons are stopped by a platinum stopper.
The bremsstrahlung is used to irradiate a magnesium oxide powder. Instead of
pure magnesium we use MgO for safety reasons. Besides several other reactions 24Ne is produced
from 26Mg by absorption of a gamma quantum and emission of two protons. We use
very fine MgO powder, because the produced 24Ne has a range
of about 1 μm in the material. In order to get a high yield most of
the 24Ne should come out of the MgO grains. After filling up its electron
shell 24Ne is a neutral atom and is
transported by a carrier gas to the ion acceleration chamber.
2.3. Comparison of both methods for production of 24Ne
In both cases besides 24Ne only few
other radioactive isotopes arrive at the ion acceleration chamber together with
the pumped gas. Therefore the measurements of the gamma spectra are not
hindered much by other activities.
Using a 22Ne gas target the producible
24Ne activity per volume is rather limited, depending on the available
intensity of the triton beam, because the produced 24Ne cannot be
separated from the original 22Ne. Using a magnesium
target a gas highly enriched with 24Ne is produced
in the irradiation chamber because the original material is solid. But for
transportation to the ion acceleration chamber a carrier gas is necessary,
which dilutes this high concentration of 24Ne. If one
uses a good combination for the carrier gas, it will be possible to increase
the concentration of 24Ne in the ion
acceleration chamber, if a part of the carrier gas is removed by a gas trap.
Until now in both ways of production the yield of 24Ne was always
large enough for the measurements we wanted to do. But for later applications
of this method it could be necessary to work with higher concentrations of 24Ne.
Another advantage of the production at an electron
accelerator is that it is easier to find electron accelerators than triton
accelerators.
2.4. Measurements
When enough 24Ne is produced
in the irradiation chamber, the 24Ne is pumped together
with the carrier gas into the ion accelerating chamber. The measurement of the
gamma spectrum starts just after applying the electrical field in the ion
accelerating chamber.
From the measured gamma ray spectra, the ratio of the
peak area of both gamma lines at 472 keV and 874 keV are calculated.
The peak area ratio R contains the information
essential for calculating the ion mobility. The parameters are the pressure p
in the ion accelerating chamber and the electrical field E between the
electrodes. The ion acceleration chamber is designed such that the change of
the peak area ratio R by movement of the ions becomes large. The chamber is a
cylinder with radius 3 cm and height 6 cm. The voltage is applied
between the top and the bottom plate. The wall between top and bottom is kept
at the medium potential. Of course, the chamber is positioned as close to the
gamma detector as possible.
2.5. Analysis of Experimental Data
The ion mobility is determined by fitting the
experimental curve of the peak area ratio R versus E/p to a numerically
calculated one. This theoretical curve is calculated in the following way.
The detection probability for gamma quanta at
different positions in front of the gamma detector is measured by using a
calibration source. Because of the relatively high pressure the ion movement by
diffusion may be neglected, and the ions move along the electrical field lines
with a drift velocity v, which is directly proportional to E/p [5]. This leads
to v = μ0 * E/p, where
μ0 is the mobility at
p = 1013 mbar. The electrical field (fig. 4)
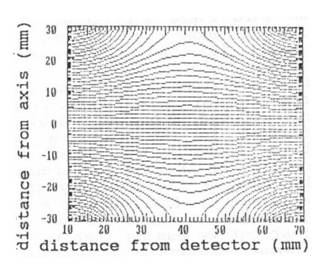
Fig. 4: Electric field
lines in the cylindrical ion acceleration chamber.
in the ion acceleration chamber is calculated by a
numerical solution of Poisson's equation.
Recombination of the ions in the gas is excluded due
to the small ionization density in the chamber. Therefore each ion which comes
into being at any place of the chamber will move on a path s(t) along one field
line to the wall of the chamber and stay there at least until the isomeric
state decays.
The detection probability for an ion that arrives at
the place (x0,y0,z0) at t=0 is
given through the following equation:

A(t) is the exponential decay activity of the
isomeric state and Pμ is the
detection probability for a fixed mobility μ depending on the path s(t).
In order to get the normalized peak area ratio one
must integrate over the whole chamber and normalize by the value without ion
movement. By this calculation for each mobility a curve like the one shown in
fig. 5 is obtained. Now this numerically calculated curve is fitted to the
experimental curve by varying the mobility μ. Fig. 5 shows the result of fitting.
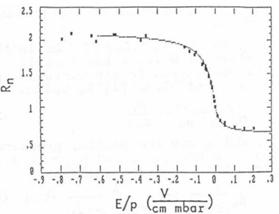
Fig. 5: Comparison of the
experimental curve with the best fitting numerically calculated curve
3. Results and Discussions
3.1. Measurements with Neon
3.1.1. Unpurified Neon Gas
The first measurements have been performed with neon
gas without purifying the gas, gas system and ion acceleration chamber. The
result is shown in fig. 5. Out of this curve μ0 = 1.65 cm2/Vs is
obtained. It is difficult to determine the error of all these measurements
because the analysis of the data is rather complicated. However, for the
mobility values we estimate the maximum error to be less than 10%.
In order to get information about the effects of the
impurities on the mobility more measurements have been done at lower pressures
of 6, 12, 20, 32 and 46 mbar (see fig 6).
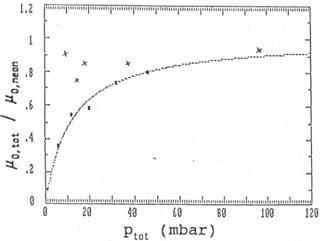
Fig. 6: Reduced ion
mobilities at different pressures in unpurified (squares with fitting curve)
and purified (crosses) neon gas
μ0,tot is the
mobility of 24Na+ in the
mixture of Ne with the impurities. For mobilities in gas mixtures the formula
of Blanc [6] is valid:
![]()
p1 and p2 are the
partial pressures of the two gases and ptot = p1 + p2. From this
equation follows:

Index i stands for impurity.
Fig. 6 contains the best fitting curve which is
obtained, if
(μ0,neon / μ0,i - 1) * pi =
12 mbar.
If, for example, pi =
1 mbar, the ion mobility in the impurity gas would be 1/13 μ0,neon. More information
cannot be obtained with certainty. But it is reasonable to assume that most of
the impurities will be nitrogen, oxygen and water vapour. In all these gases
the mobility should be much larger than only a thirteenth of the one in neon.
Therefore the water molecules are expected to build clusters together with the
ions because of their large permanent dipole moment. These ion clusters have
much lower mobilities than free ions, what Munson [7] and Tyndall already had
seen.
4.1.2.
Purified Neon Gas
After improving the experimental setup the measurement
chamber can be baked out at 200°C and the
incoming gas can be cleaned by passing a liquid nitrogen cooled trap.
Again we measured with neon gas at different
pressures. The result is shown in fig. 6. The effect of gas cleaning is
clear. The ion mobility decreases only slowly with decreasing pressure and the
mobility value at 1000 mbar increased to μ0=3.2 cm²/Vs,
which is nearly double the value of the mobility in unpurified neon gas. This
value should be compared with the zero field mobilities of Na+ ions in neon
of 8.87 cm²/Vs by Tyndall [1] and 8.27 cm²/Vs by Akridge [2].
They measured at pressures far below 1 mbar.
Because the reduced mobility should be constant in the pressure range above
1 mbar, the zero field mobility of Akridge should be the same as the
mobility of our measurements. But there is a large difference. The reason is
not quiet clear but we assume that there is a large interaction between the ion
and environmental gas atoms due to monopole-induced-dipole forces. This
interaction increases fast with decreasing distances between ions and atoms and
therefore also with increasing pressure. This would also explain the slight
decrease in the mobility with decreasing pressures in fig. 6. Due to this
interaction there may be even in the rare gas neon temporary clustering of
neutral neon atoms on the ions at room temperature at such high pressures we
used.
But we cannot exclude that in spite of purification
there remain some impurities in the gas, because we can not analyze the gas in
the ion acceleration chamber. Probably most water molecules are removed by the
liquid nitrogen trap, but oxygen and nitrogen molecules may pass the trap.
4.2. Measurements
with He - Ne Mixtures
Because the gas is purified with a liquid nitrogen
trap there are only few gases which can be used for measurements with purified
gas, i.e. helium, neon and hydrogen. Some measurements have been done with
mixtures of helium and neon. At both mixture ratios (50% He with 50% Ne and 93%
He with 7% Ne) we got using Blanc's mixture formula:
μ0,helium / μo,neon = 2.4
This is close to Akridges [2] ratio of 2.74 for the
zero field mobilities in the two gases, if we consider the errors and small
rest impurities which decrease this ratio as Munson [7] has shown.
4.3. Measurements with
Ne-Ethanol Mixtures
In order to test possible applications of the tracer
method a series of mobility measurements has been performed in different
mixtures of neon and ethanol. The different ethanol partial pressures are
obtained by cooling or heating the whole ion acceleration chamber. The ethanol
partial pressure is the vapour pressure above the liquid ethanol at the used
temperature. Into this system we pump the necessary amount of not irradiated
neon gas and afterwards the irradiated neon gas. Fig. 7 shows the results of
the measurements.

Fig. 7: Relative
mobilities of Na+ ions in different neon-ethanol mixtures with best fitting
curve for μ0,neon / μ0,ethanol = 9.
μ0,tot / μ0,neon is shown
depending on the ethanol concentration. Using Blanc's formula the best fitting
curve is calculated for
μ0,neon / μ0,ethanol = 9.
One of the reasons for this low mobility value in
ethanol vapour is the large cross section of the ethanol molecule, which exists
of nine atoms. But this is not enough to explain such a strong decrease of the
mobility. Cluster growth by attachment
of ethanol molecules to the ions will
decrease the ion mobility efficiently. Also the easy excitability of ethanol
molecules may contribute to the lowering of the mobility.
4.4. Mobility
Measurements in a Diffusion Cloud Chamber
In order to see what happens to the ion mobility in a
region of supersaturation an experiment with a diffusion cloud chamber has been
performed [8], [9]. An electric field is applied in the lower third of our
diffusion cloud chamber where the supersaturation should take place. The
irradiated neon gas is put into the cloud chamber during its performance. Neon
serves as carrier gas. We use pure ethanol as liquid and diffusion gas. The
input neon gas pressure is measured. The mean ethanol partial pressure is
calculated from the measured total pressure. The gas partial pressures depend
strongly on the height in the chamber due to the temperature gradient. In order
to generate the electric field for the ion movement different things have to be
fixed inside the chamber. Due to condensation on this material it is not
possible to run our diffusion cloud chamber in a steady state with a constant
supersaturated region. But we can show the behaviour of the ion mobility
compared with the value of the mobility in pure neon during the initial phase
when the cover is heated up and the bottom is cooled down.
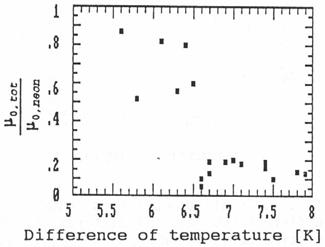
Fig. 8: Relative ion
mobilities in a diffusion cloud chamber depending on the temperature gradient
in the chamber.
Fig. 8 shows the mobility depending on the
gradient of the temperature. The temperatures are measured a little below the
cover plate containing the liquid ethanol and a little above the bottom. The
difference of these temperatures is plotted on the x-axis. The errors of the
mobility measurements in the cloud chamber are rather large due to a
disadvantageous geometry for the gamma measurements caused by the construction
of any cloud chamber. Therefore the values of the mobility scatter rather much.
But the figure shows that at a certain temperature gradient in the cloud
chamber the ion mobility decreases suddenly. This effect can only be explained
if the supersaturation suddenly exceeds a value above which the sodium ions
cause rapid condensation of the ethanol vapour. The ions grow quickly (compared
to the trace time of 20 msec) to large clusters or even small droplets,
which causes a large decrease in the mobility.
The result of the cloud chamber experiments is clear:
This method for mobility measurements can be used to detect clustering effects
in such a condition critically close to condensation.
5. Concluding Remarks
The introduced tracer method is well suited for
measurements on the mobilities of positive charged sodium ions in gases with
pressures larger than 1 mbar. Measurements at lower pressures should be
possible after improving the experimental setup. But the increasing movement by
diffusion would destroy the indirect proportionality of the mobility to the
pressure. Also the collision rate goes down and the ions will no longer move
along the electrical field lines. The movement caused by the recoil of the ß-decay will
increase too. All these facts together will effort another method for
calculating the movement of the ions which is necessary for the analysis of the
experimental data.
The usable pressure range is interesting because most
other methods for cluster studies don't work at such high pressures.
Measurements up to high pressures of some 100 bars are possible with this
method. With a proper setup studies on the mobility change towards the
condensation point and eventually towards the critical point are possible with
this method.
Acknowledgement
This work was supported by the Japan Society
for Promotion of Science.
References
1.
Tyndall A.M., Powell C.F.: Proceedings of the Royal Society of London A 136,
145 (1932
2.
Akridge G.R. et.al.: J. Chem. Phys. 62, 4578 (1975)
3.
Lederer C.M., Shirley V.S.: "Table of Isotops", John Wiley % Sons
Inc., New York, 7th ed. 1978
4.
Detailed information about the experiment see B. Abmayr: "Messung der
Beweglichkeit von Ionenclustern unter Benutzung des 20 ms-Isomers 24mNa
als Tracer", Diplomarbeit at the Technical University Munich, Department
of Physics, January 1989.
5.
see for example Vol XXII, part I, chapter 4 of K.Przibram: "Handbuch der
Physik" (ed.: H. Geiger, K. Scheel), Verlag von Julius Springer, Berlin
1933
6.
Blanc A.: Bull. Soc. Franc. de phys. 1908, p.156
7.
Munson R.J., Tyndall A.M.: Proceedings of the Royal Society of London A 172,
28 (1939)
8.
For detailed information on diffusion cloud chambers see e.g.: H. Slätis, Nucl.
Instr. and Methods 1, 213 (1957) or Katz J.L. et al., J. Chem. Phys. 62,
448 (1975)
9.
For study of nucleation in diffusion cloud chambers see e.g.: Rabeony H.
et al., J. Phys. Chem. 91, 1815 (1987)